Strengthening Bay Area Businesses With Modern Cybersecurity Services
Updated on: November 6, 2025
How Cybersecurity Challenges Are Increasing for Bay Area Organizations Cyber attacks have become more frequent, complex, and targeted, especially in…

Everyone talks about speed. Gigabits per second, download rates, upload benchmarks — these are the numbers ISPs put on billboards. But ask any network engineer what actually determines whether your video call drops, your VoIP call crackles, or your cloud app spins forever, and they’ll give you one answer: latency.
On May 5, 2026, we measured our network across 3,458 IP addresses throughout the Bay Area. Our average latency came back at 7.2 milliseconds. Our median was 6 ms. Nine out of ten of our endpoints responded in under 14 ms.
That’s not a marketing claim. It’s a measurement — and in this post, we’re going to explain exactly why it matters for your business, how we compare to every major ISP type, and what you should actually be asking your internet provider.
Bandwidth is how much data your connection can carry. Latency is how quickly a signal travels from your device to its destination and back. It’s measured in milliseconds (ms), and it directly governs the responsiveness of everything you do online.
Think of bandwidth as the width of a highway, and latency as the speed limit. A 10-lane highway with a 20 mph limit moves slower than a 2-lane road with a 70 mph limit. In the Bay Area’s cloud-first business environment, most applications don’t need more bandwidth; they need a faster speed limit.
We don’t ask you to take our word for it. Here is the data from our May 5, 2026 internal network audit across 3,458 monitored IP addresses:
| 3,458 | 7.2 ms | 6 ms | 14 ms |
| IPs Measured | Average Latency | Median (P50) | 90th Percentile |
The 7.2 ms average means our typical customer experiences network round-trip times that are competitive with some of the best dedicated fiber providers in the country — and nearly 3× faster than cable internet on average.
The 14 ms 90th percentile is particularly meaningful: it tells you that even our slowest-responding endpoints still deliver performance that cable ISPs consider their average. There are no outlier locations quietly dragging down the experience.
Internal network measurement · May 5, 2026 · Bay Area, CA
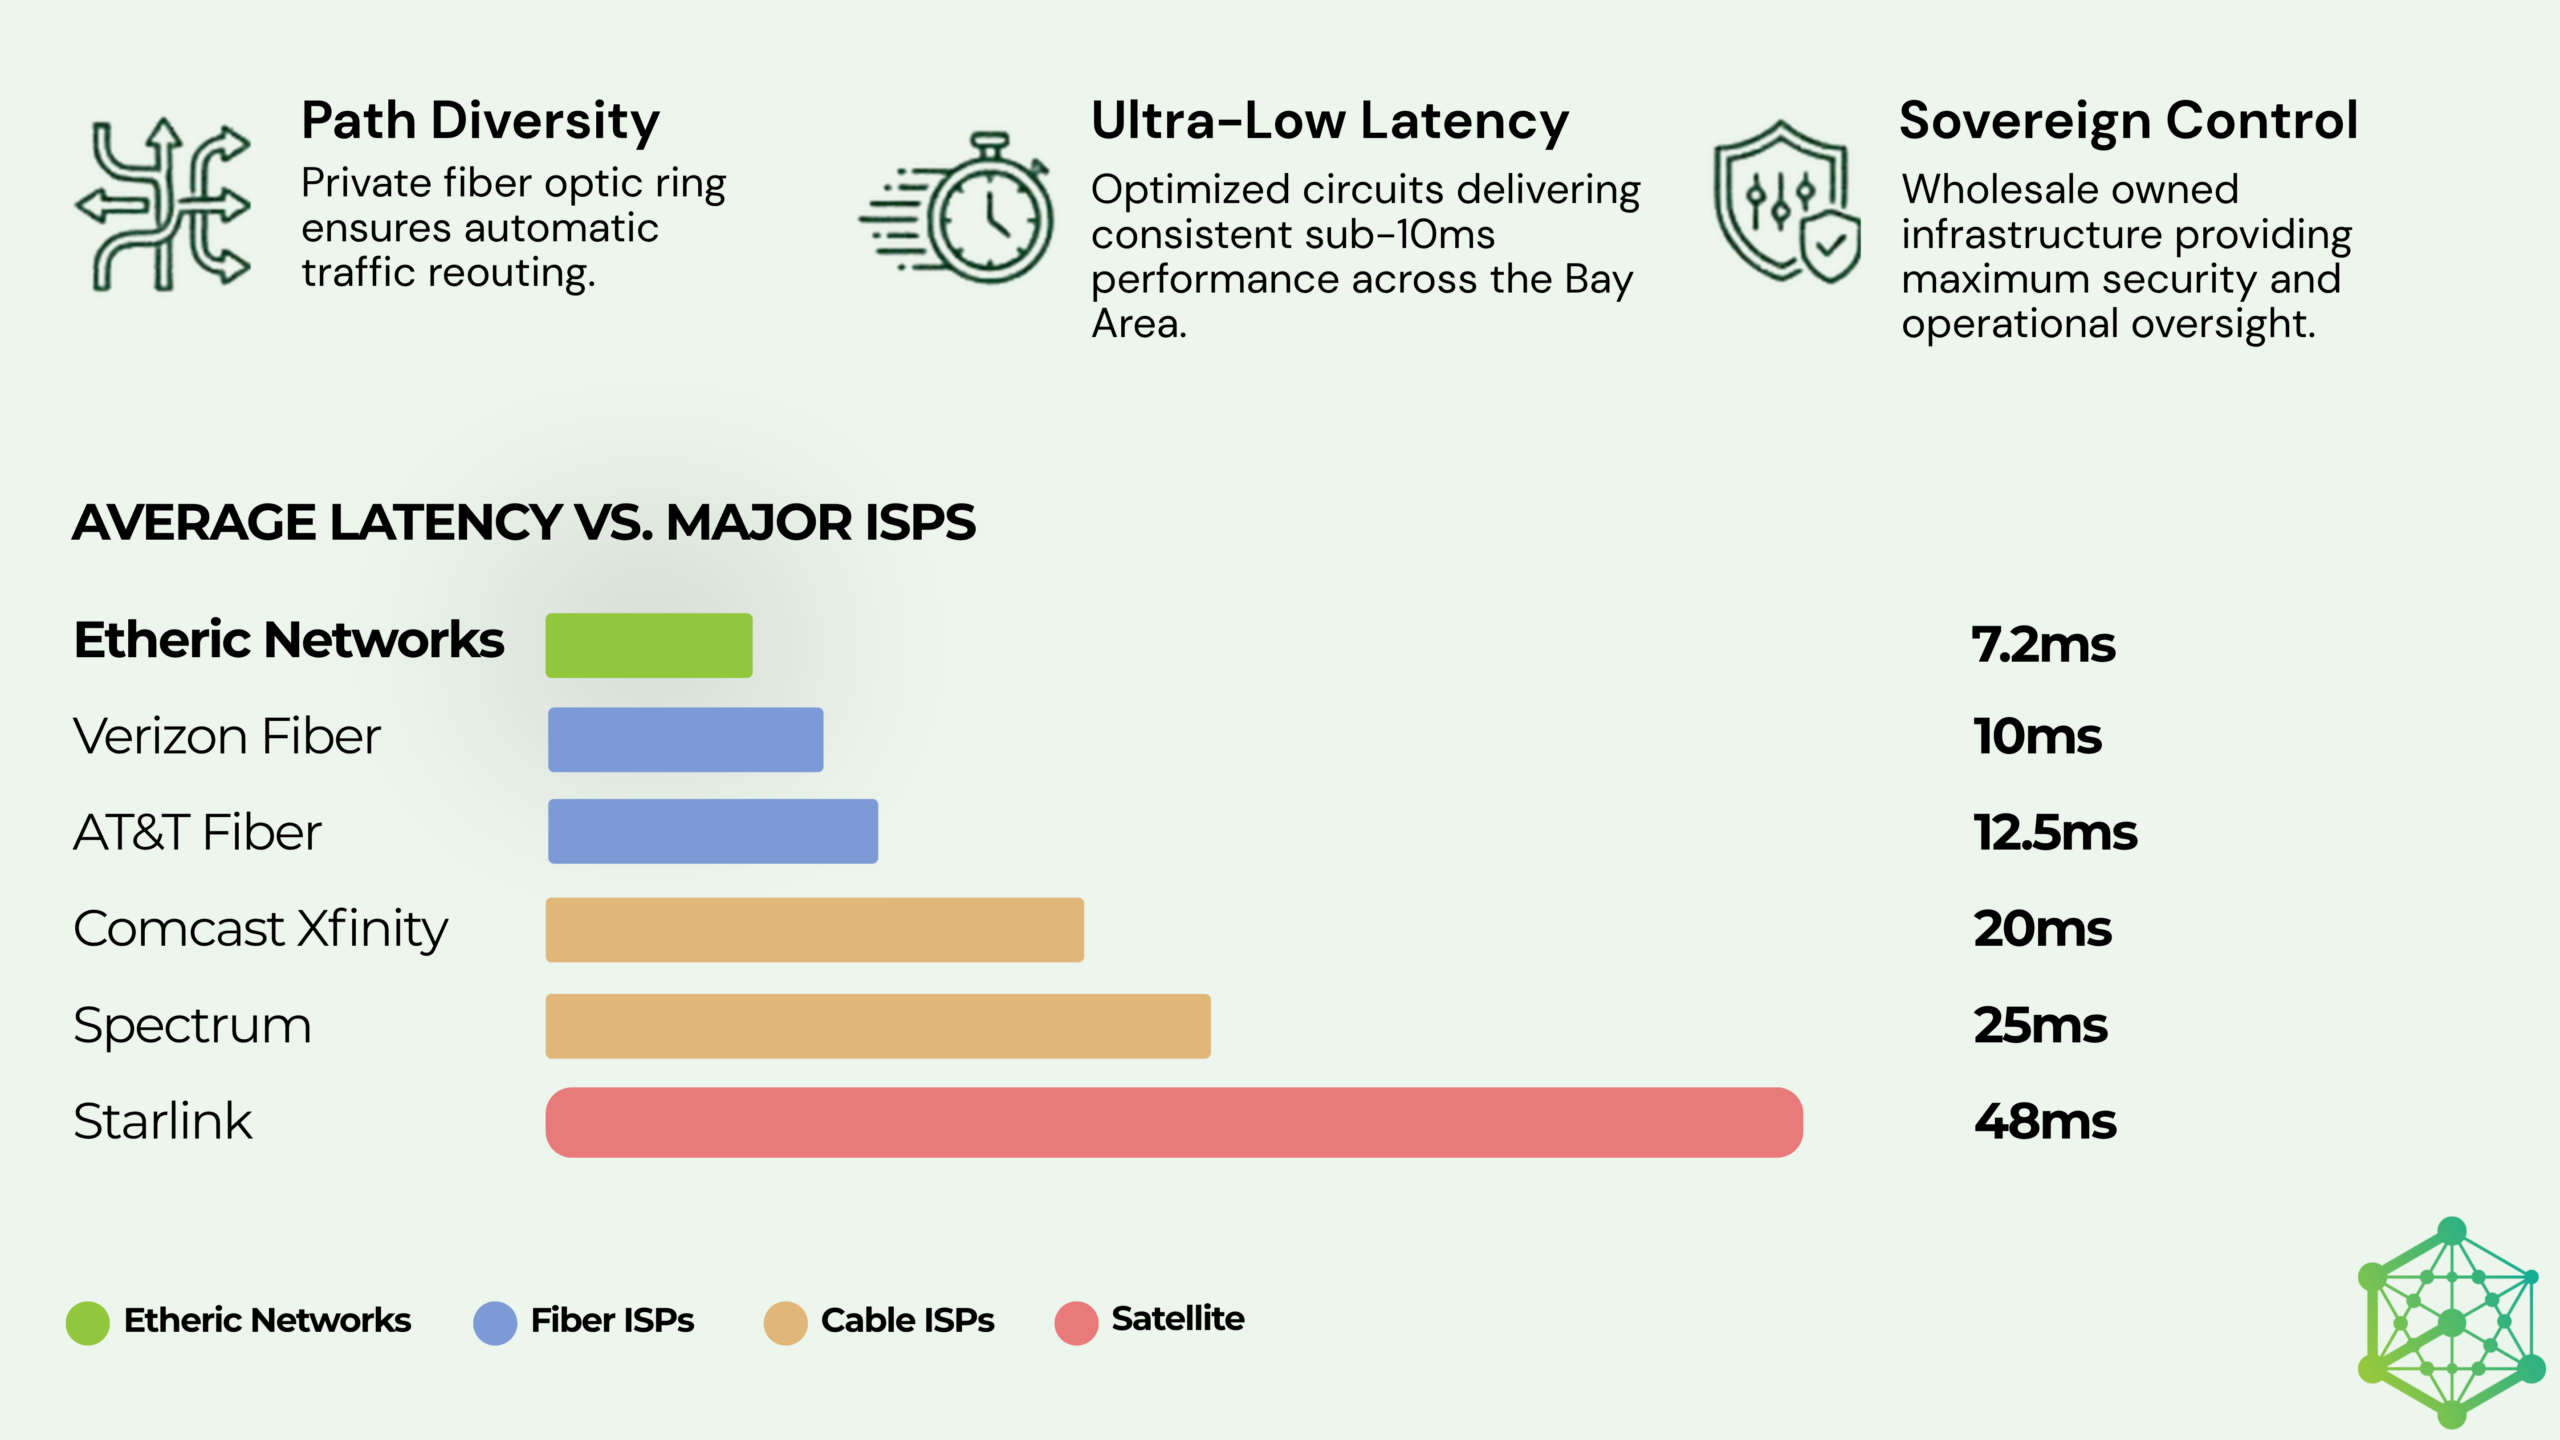
Latency is rarely disclosed by ISPs in their marketing. Here is how our measured performance stacks up against published industry averages from Ookla and Pong.com (2025–2026):
| Provider | Type | Avg Latency | vs. Etheric |
| Etheric Networks | Fixed wireless + fiber | 7.2 ms ✓ | — |
| Verizon Fios | Fiber | 10 ms | 1.4× slower |
| AT&T Fiber | Fiber | 12.5 ms | 1.7× slower |
| Comcast Xfinity | Cable | 20 ms | 2.8× slower |
| Spectrum | Cable | 25 ms | 3.5× slower |
| T-Mobile 5G Home | Fixed wireless (5G) | 32 ms | 4.4× slower |
| Starlink | Satellite (LEO) | 48 ms | 6.7× slower |
Sources: Ookla Speedtest Global Index, Pong.com ISP Report Card 2025–2026. Competitor figures are published industry averages, not direct head-to-head tests. Etheric figures: internal measurement May 5, 2026.
The key takeaway: Etheric’s fixed wireless plus private fiber hybrid architecture delivers latency that rivals or beats many pure-fiber providers, at a fraction of the deployment complexity — and in locations where fiber simply cannot be trenched.
Low latency doesn’t happen by accident. It is the result of deliberate architectural decisions we have been refining since 2003.
Our backbone is not a resold carrier circuit. We operate a private dark fiber ring encircling the Bay Area, connecting our 8 data centers directly. Traffic between our customers and the internet traverses our own infrastructure — no shared congestion points, no handoffs to third-party backbones.
We maintain direct peering relationships with major content providers and cloud platforms. When your employee opens Salesforce, sends a Slack message, or joins a Zoom call, that traffic takes the shortest possible path — not a convoluted route through multiple carrier handoffs.
Our fixed wireless towers are engineered for point-to-point line-of-sight transmission using licensed ISM and U-NII band spectrum. Unlike 5G home internet that shares cellular spectrum with mobile users, our dedicated fixed wireless links are not competing with thousands of smartphones for bandwidth.
Our 24/7 NOC team monitors latency, packet loss, and jitter across every link in real time. When we detect degradation, we reroute traffic proactively before customers notice. This is what the 99.997% uptime SLA is backed by.
Most ISPs do not volunteer latency data. Here are the questions every Bay Area business should ask before signing an internet service contract:
| Application | Target Latency | Etheric (7.2 ms avg) | Cable (20–25 ms) |
| Video conferencing | < 20 ms ideal | ✓ Excellent | ✓ Adequate |
| VoIP / cloud phone | < 10 ms ideal | ✓ Excellent | ✗ Marginal |
| Cloud ERP / CRM | < 20 ms | ✓ Excellent | ✓ Adequate |
| AI / real-time APIs | < 10 ms | ✓ Excellent | ✗ Marginal |
| Competitive gaming | < 15 ms | ✓ Excellent | ✗ Marginal |
| 4K video streaming | < 100 ms | ✓ Excellent | ✓ Fine |
If your current ISP cannot tell you their average latency, median latency, or 90th percentile, that’s a problem worth solving. Etheric Networks has been connecting Bay Area businesses since 2003 with a privately owned dark fiber ring, 8 data centers, and a hybrid fixed wireless architecture that delivers fiber-grade performance to locations traditional providers cannot reach.
We deploy in days, not months. Free site survey included. No data caps, no throttling, and we never sell your data.